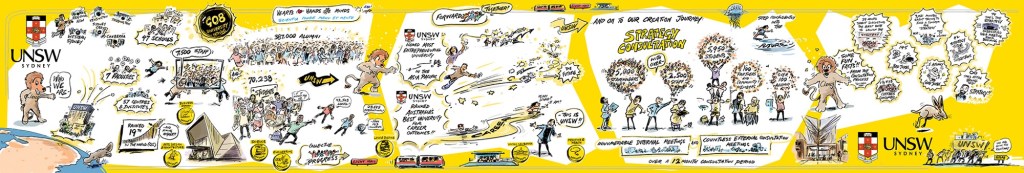
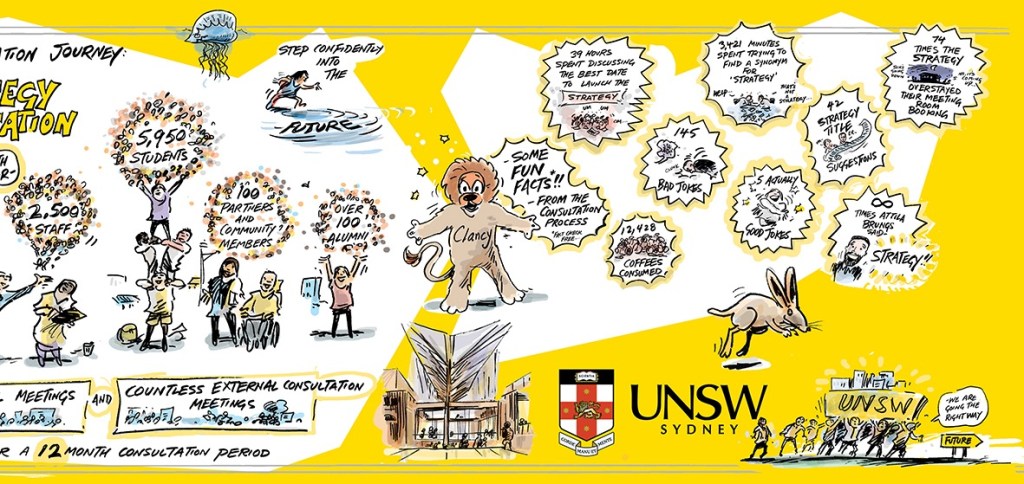
Artwork for a 7 metre long banner illustrating the University of NSW’s strategy consultation, to be used at an internal conference. Commissioned by Laundry Lane.


Artwork for a 7 metre long banner illustrating the University of NSW’s strategy consultation, to be used at an internal conference. Commissioned by Laundry Lane.

Some of the water engineering diagrams for Water Sensitive SA.
‘Water Sensitive SA supports government, industry and community to mainstream water se nsitive urban design and integrated water management practices that enhance wellbeing and ecological health.’


What to know when you come across a horse and rider on a walking trail. Horse SA produces a wide range of resources for horse owners in South Australia.

For more information see Horse SA or Dung Beetle Solutions.
A whiteboard style animation for the Class Teaching website explaining the value of their eJournal for teachers and school leaders.
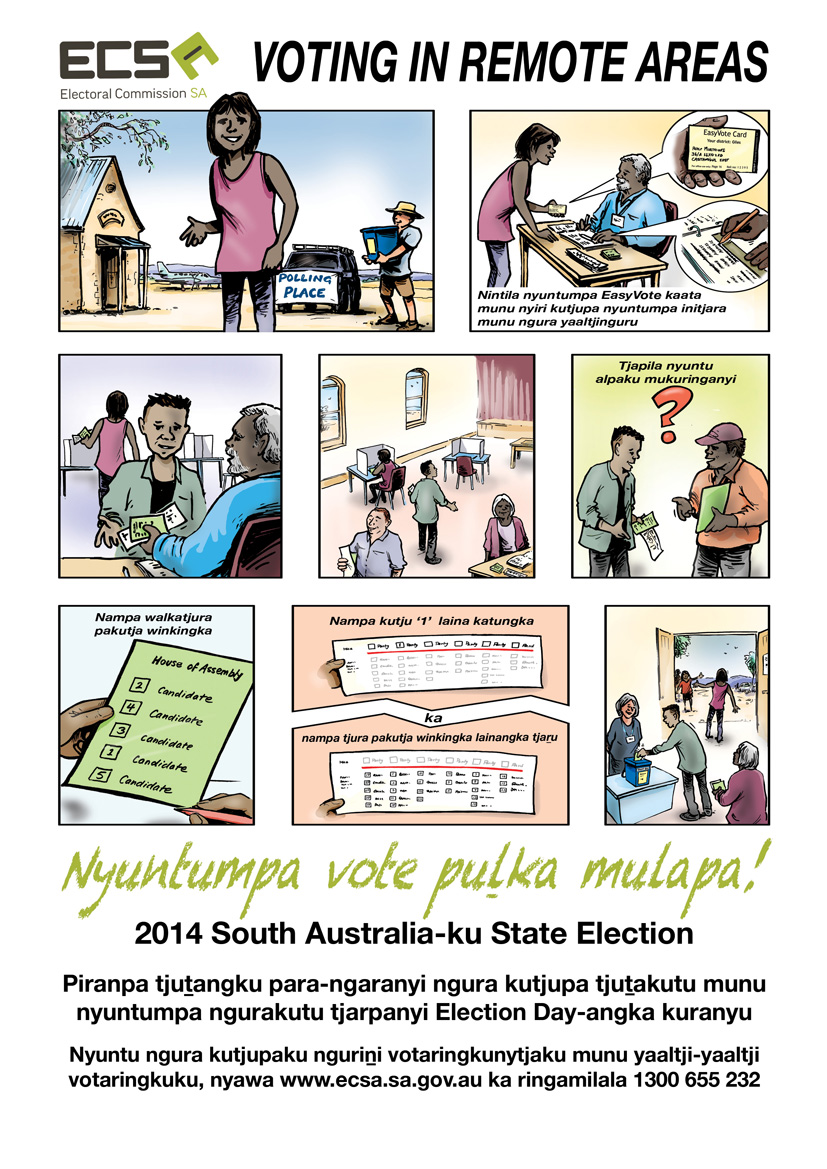
Two posters designed for the South Australian Electoral Commission to explain how to vote in the upcoming state election. The posters are designed for voters who are unfamiliar with how the process works or have limited English. Originally it was intended that the posters would work without any text however some words were necessary to help make the process clear. One of the posters has been adapted for remote communities where Electoral officials are flown or driven in, and it has been translated into the Pitjantjatjara language.

Here is a cartoon originally drawn during the ‘Show me the change’ conference for community organisations. It has been revived for use with RMIT University’s Better Evaluation project.

id Informed Decisions are the Australian and New Zealand ‘population experts’ providing demographic profiling and forecasting: ‘We believe that by making demographic information accessible to the broadest possible audience, and promoting evidence-based decision making, we are contributing to a fairer and more sustainable society’.
Their id blog has many observations drawn from a range of data. A prime source of data being the 2011 Australian Census.
Here are some of the small graphics drawn for a number of the blog posts.

The coffee economy

2012 review

Grim reaper

Economic modelling
The latest issue of Australian Options is out. To subscribe click here.
Below is a cartoon drawn to illustrate one of the articles in this issue: ‘Policy in the wake of the banking crisis: taking pluralism seriously’ by Sheila Dow.
As the article states ‘There is a limit to how far economists can understand a complex reality, far less predict the future. But fostering a range of perspectives and analytical methods would make economics much more robust in the face of unexpected developments …’

Health SA’s Tobacco and Mental Illness Project has produced many resources for people with a mental illness – who are more likely to smoke, and smoke more heavily than the general population. For example a study has reported that 60% of people with schizophrenia smoke.
More information and links to some of the resources can be found at: http://www.quitsa.org.au/aspx/mental_health.aspx
and details of the Project at:
http://www.quitsa.org.au/aspx/quit_sa_programs.aspx#6
The resources have used cartoons and graphics to help explain the project’s aims of awareness, practice change and reduction. Cartoons can (I hope!) connect with a reader, empathise, and help them through the text.
Here are some examples.


Stages of Change
