Graphics and diagrams are strong communication tools – and, if all works out, interesting and attractive to look at. Here are some examples:

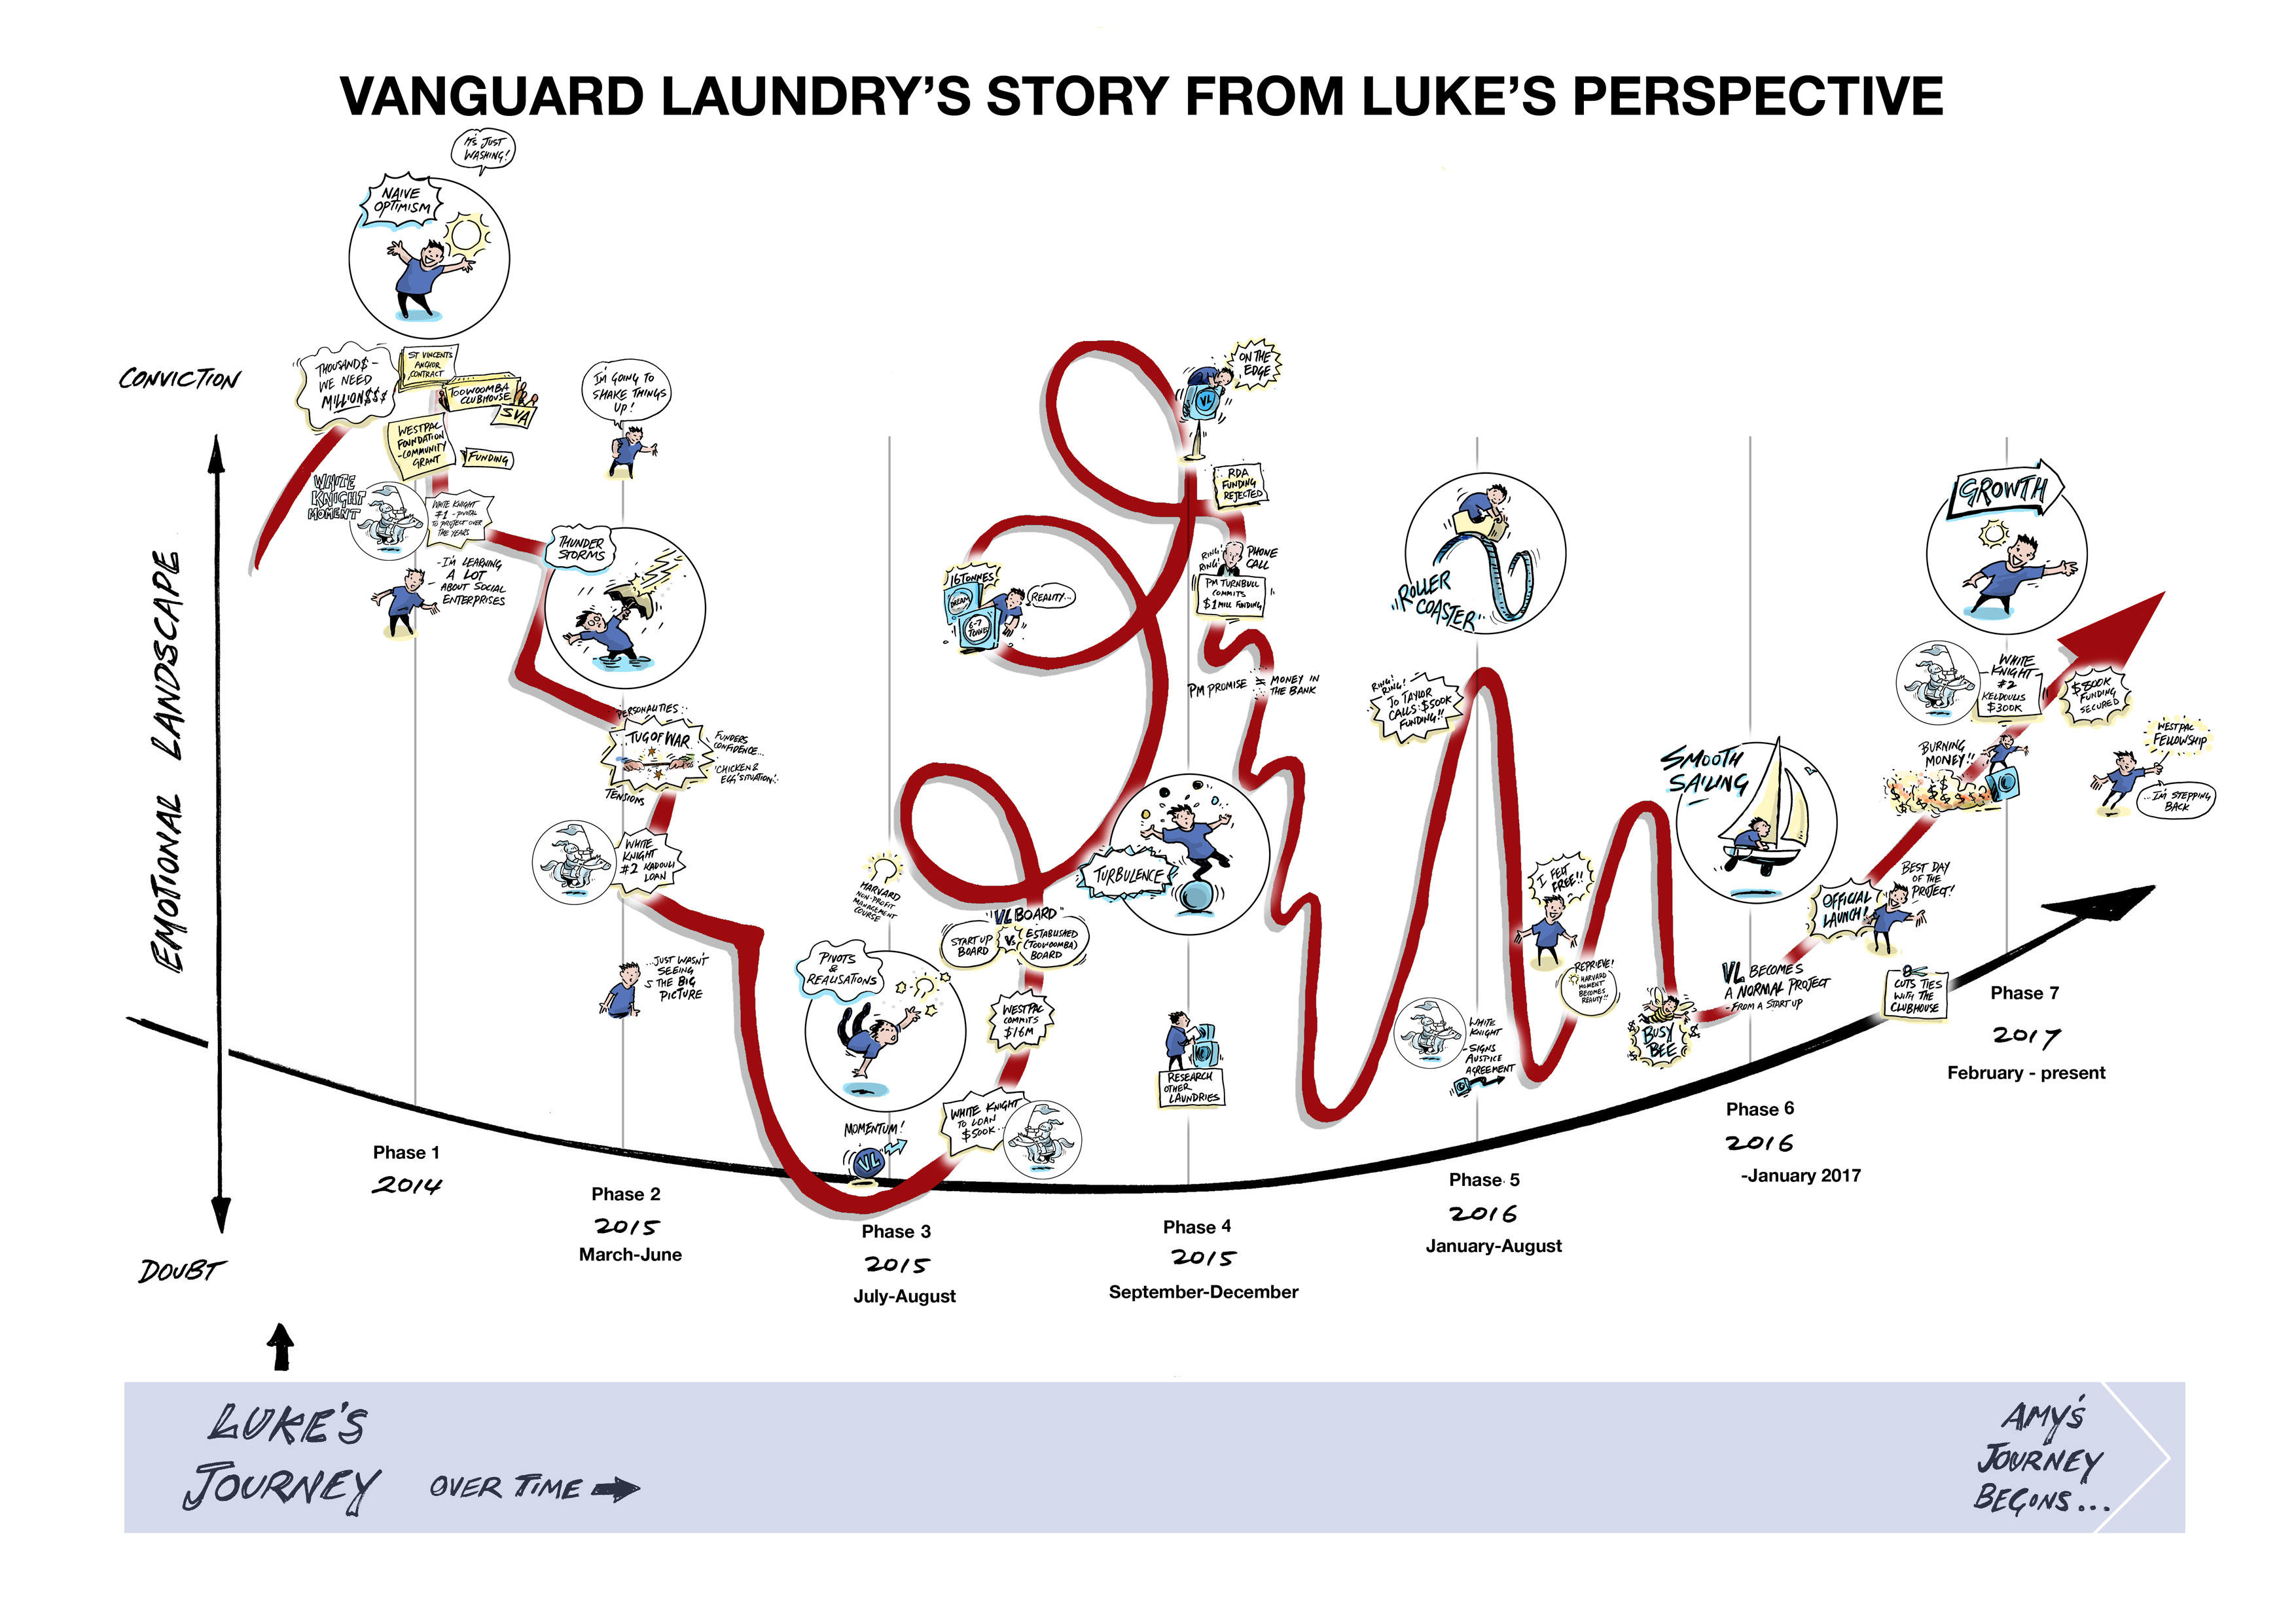


Weaving stories…

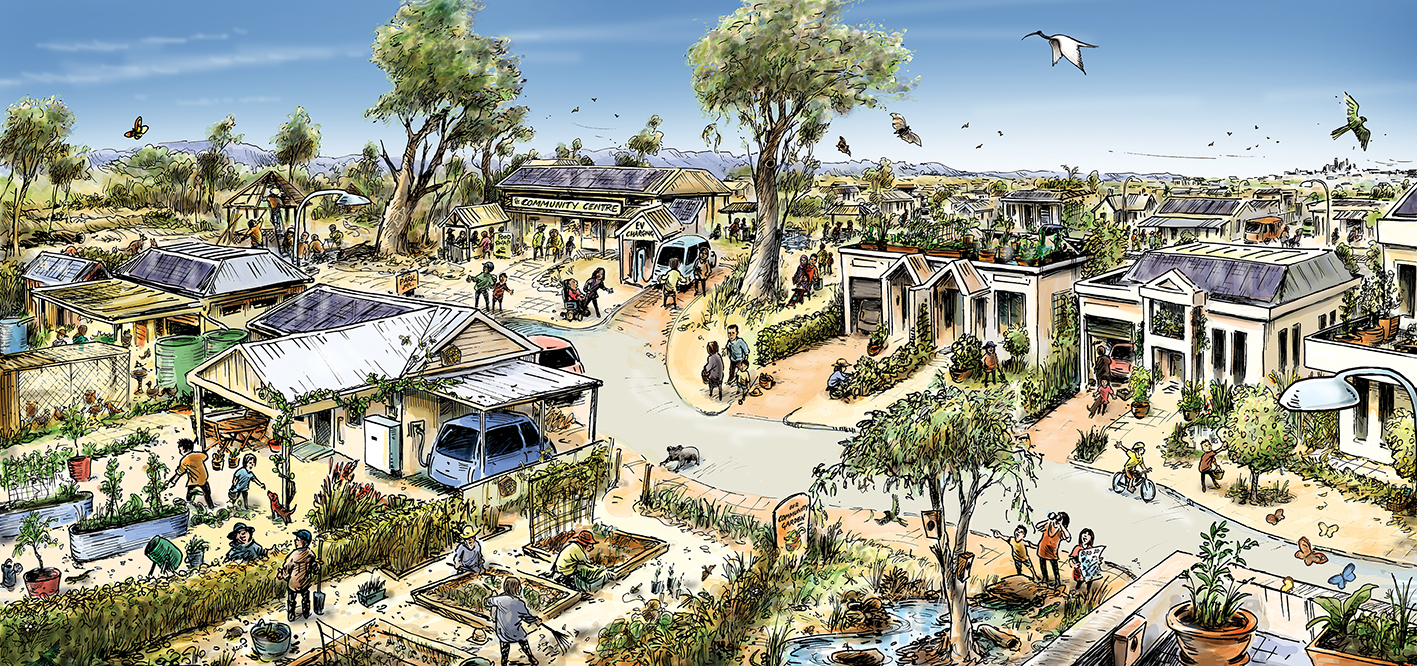
People planning

The Flow Zone – another Babelfishgroup graphic

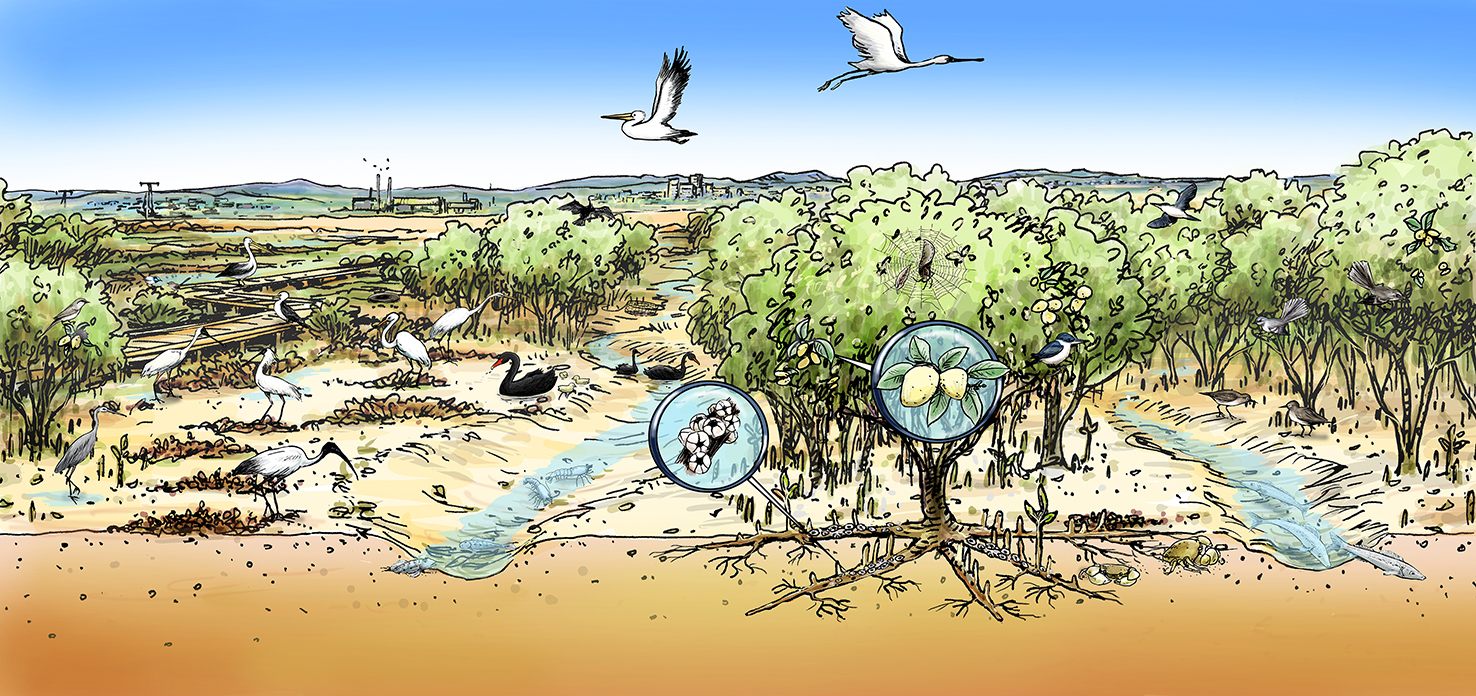
It’s a cycle….

Conference program in a graphic

Overdone strength variables

Developed in a group workshop

Horse health

Horse SA hot weather chart
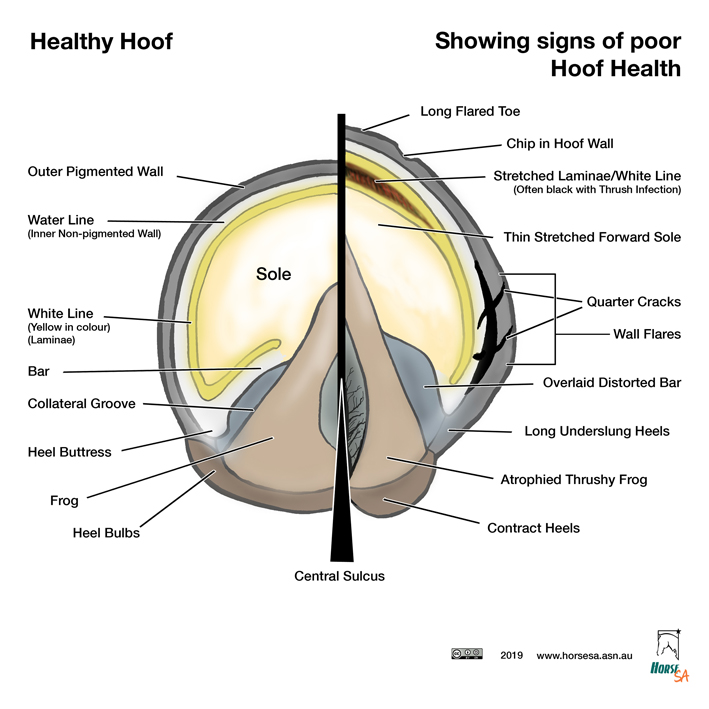
Horse hoof health


2 Comments
i think your graphics and story telling is amazing. Do you have anything on gambling harm in Australia?
Thank you Lyn! I have done a few things on gambling, I will try and find them and let you have a look.